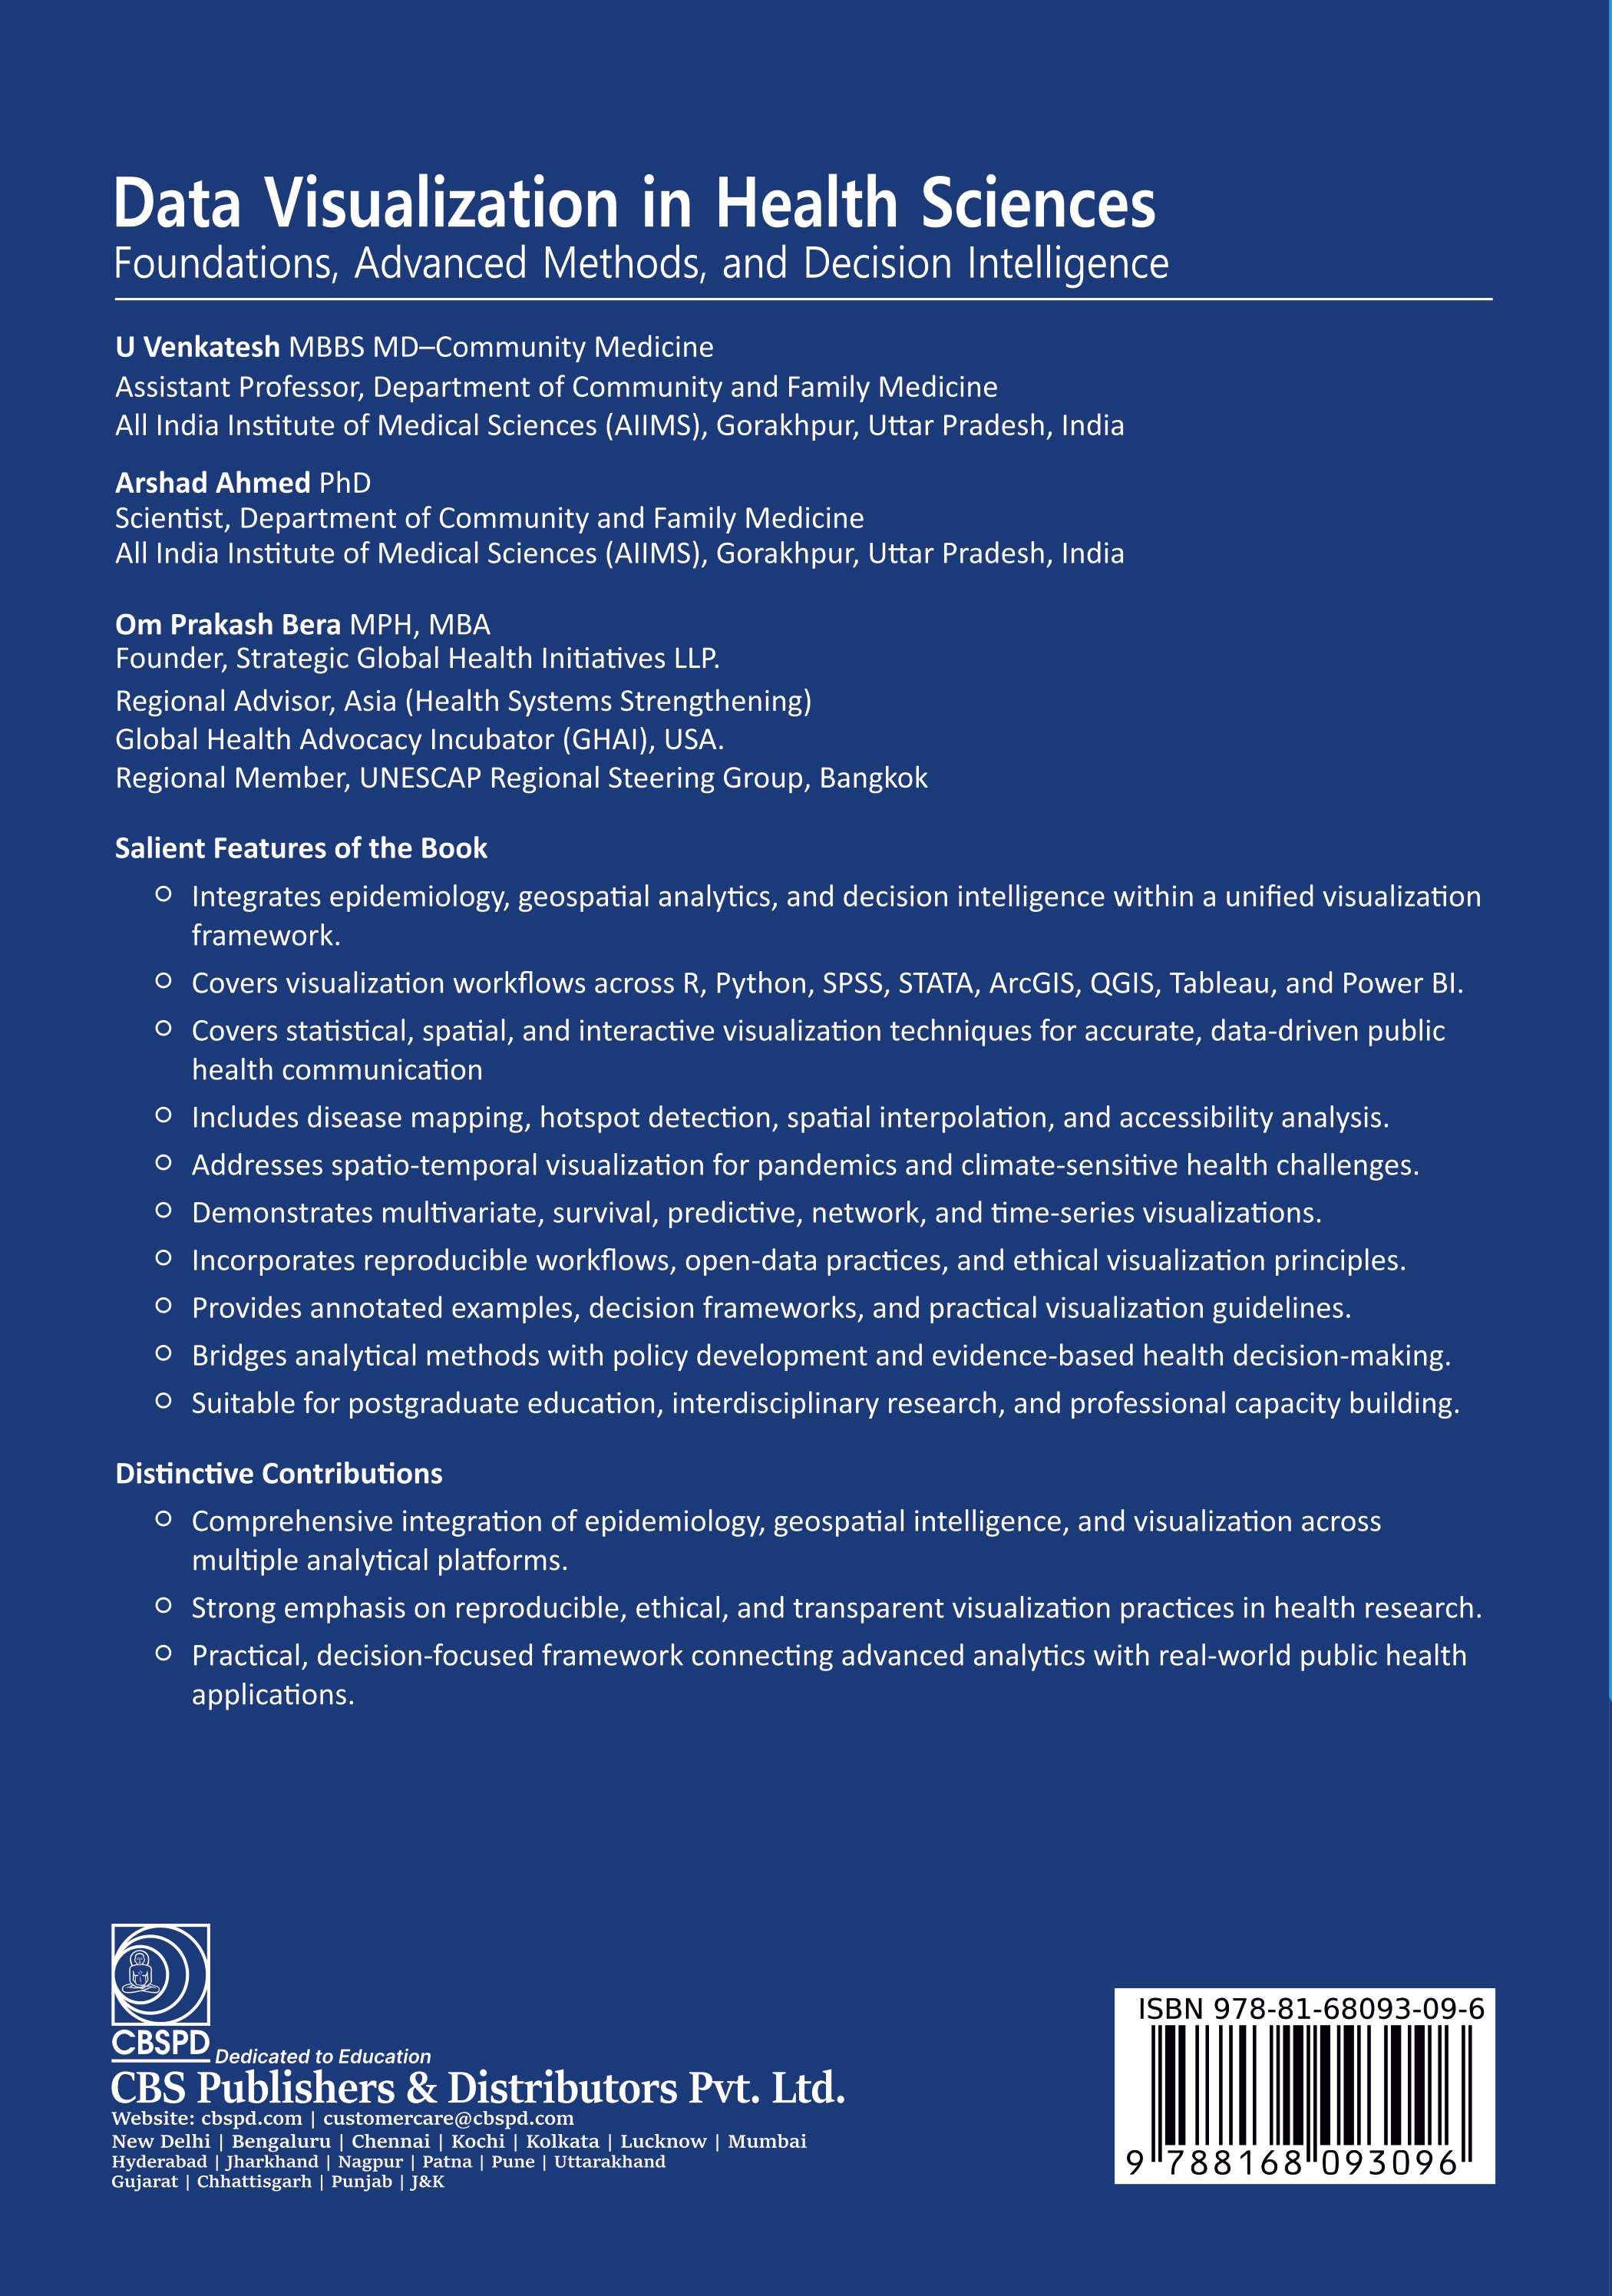
Data Visualization in Health Research: Integrating Epidemiology, Geospatial Analytics and Decision Intelligence is a methodologically advanced volume addressing a critical challenge in health sciences: transforming complex epidemiological, clinical, and spatial data into clear, decision-oriented visual outputs.
As health data expands from surveillance systems, electronic records, population surveys, and geospatial platforms, the ability to communicate evidence through visualization has become essential. This book provides an integrated framework linking data visualization with epidemiological reasoning, spatial analytics, and policy-driven decision-making—moving beyond descriptive approaches to emphasize statistical integrity, perceptual accuracy, and bias minimization.
A defining feature is its multi-platform approach, spanning R, Python, SPSS, STATA, ArcGIS, QGIS, Tableau, and Power BI—reflecting real-world practices in global health institutions.
The volume covers techniques from foundational statistical graphics to advanced formats: multivariate visualizations, time-series analysis, survival curves, network graphs, geospatial mapping, and interactive dashboards, each contextualized within applications like disease surveillance and health inequality mapping. Special emphasis falls on spatio-temporal visualization for challenges such as pandemics and healthcare accessibility.
The book also incorporates reproducible workflows, open-data principles, and ethical standards, making it suitable for postgraduate teaching, professional training, and policy-oriented capacity-building.

.png)
.png)